
Beamline Phone Number:
+44 (0) 1235 778418
Principal Beamline Scientist:
Dave Allan
Tel: +44 (0) 1235 778644
E-mail: [email protected]
Email: [email protected]
Tel: +44 (0)1235 4494052
Normally, the first collection on a new sample will be a screening run to determine the optimum level of attenuation as it is important to ensure reflections on the detector are not overloaded
The top line of any pre-defined run list is a screening run (Experiment Type = Screening) and is a phi scan consisting of 450 0.1° images. The default transmission for screening is set to 1% but this can/should be adjusted in the table once you have a feel for what an appropriate level is likely to be.
Note: The transmission set in the data collection table will override any transmission value set anywhere else.
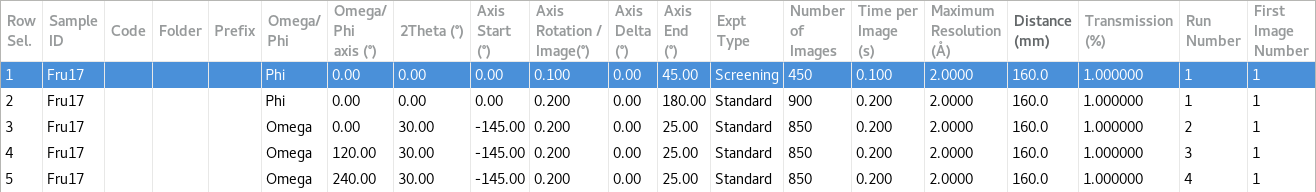
Click on the row under Row Sel. in the table to highlight this row and then click on Run Selected to collect these images.
![]()
Use the output from Screen19 to determine what transmission should be used for the full data collection, and how long images should be collected for. Screen19 will suggest the optimal level of attenuation based on the cell it calculates. Aim for no more than 25% on the pixel intensities plot, but remember 25% is the maximum and not a target level.
Multiple screening runs may be needed to decide on the best attenuation level and they should be collected in separate directories to ensure Screen19 runs on images with a single transmission setting.
The results from Screen19 are best viewed in a terminal window (right click on the desktop and open a new terminal window) where the results will automatically update.
If the terminal does not automatically open in your current visit directory,
type "module load i19" and press enter, then
type "i19.tail" at the prompt and press enter
If the terminal window opens with the prompt showing your current visit directory, you should be able to go straight to the i19.tail step.
(The program may time out if the wait for the first set of images to be collected takes too long – just type it again if this happens.)
Screen19 is run on every full scan of data collected, not just the screening run. These results can be found in the “processed” directory if needed: processed/foldername/imagename_runnumber__sweep/screen19
Type "gedit screen19.log" once in the appropriate directory to view the log file [Ctrl C to exit]
NOTE: the other output files from the processing are are only stored for one week in the tmp directory. These can be found in \tmp\zocalo\foldername\imagename_runnumber__sweep\screen19
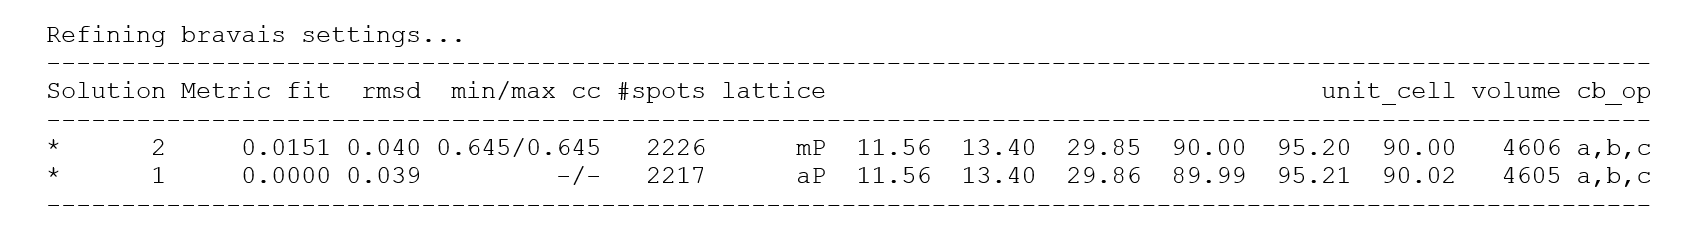
If the program has worked, the final section of the output is a list of possible unit cells. Check that the unit cell found looks sensible with a reasonable metric fit.
 Scroll back up and find the plot showing the spot intensity distribution.
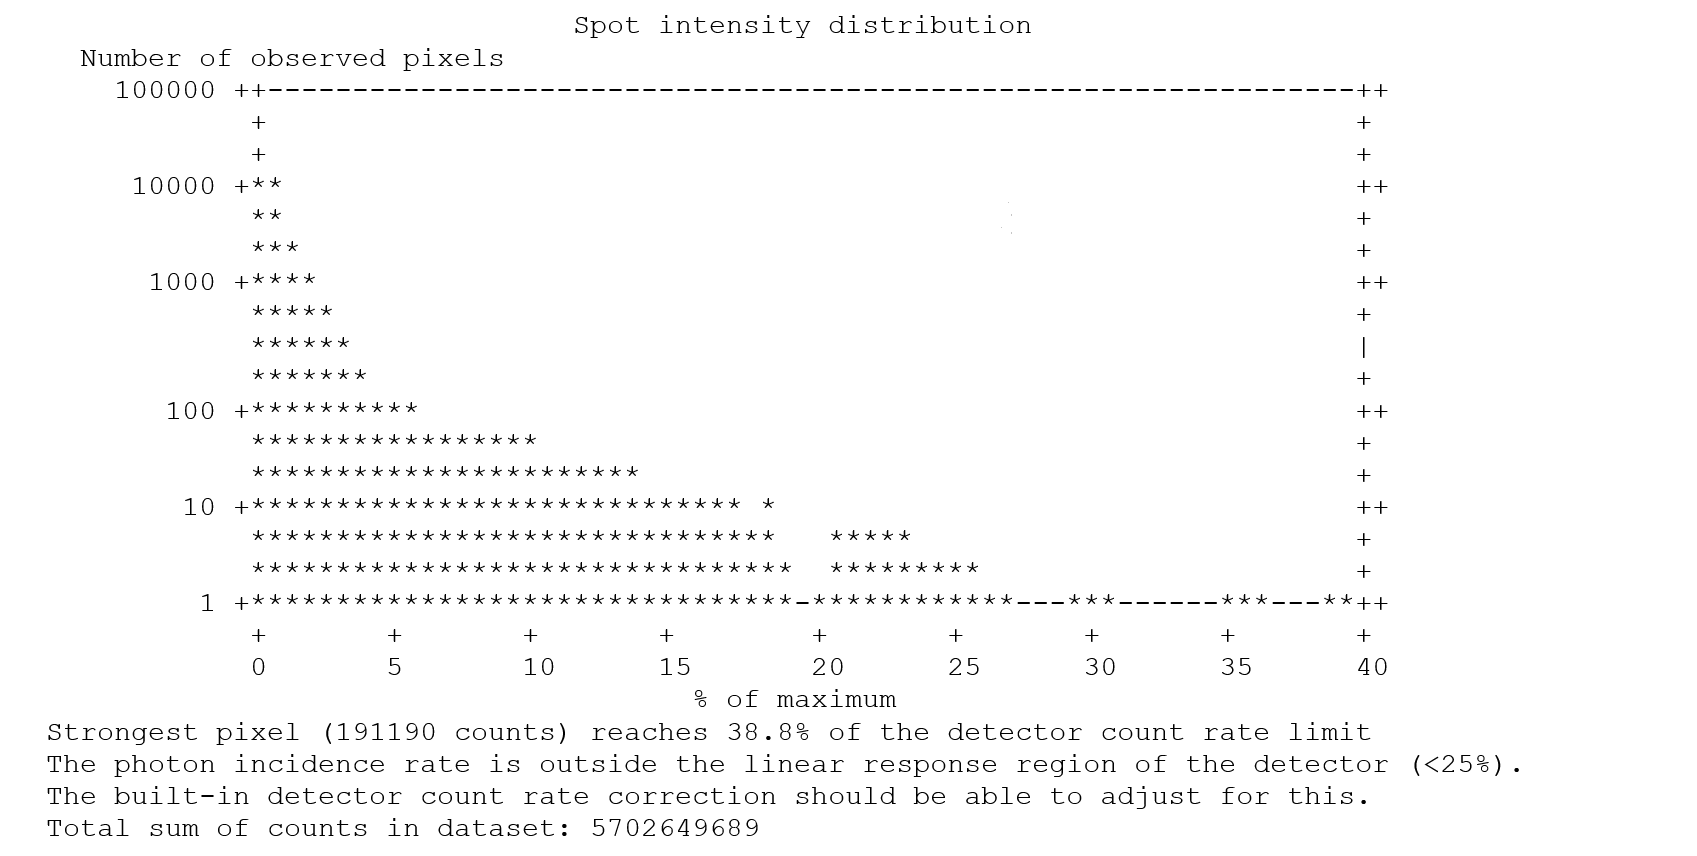
Note the value given for the maximum percentage of the detector count rate limit and the shape of the histogram - the final column of points in the histogram should be ignored.
Also consider what the diffraction limit looks like from the Wilson plot - the table below gives an indication of the transmission required to get good quality data to various resolution levels.
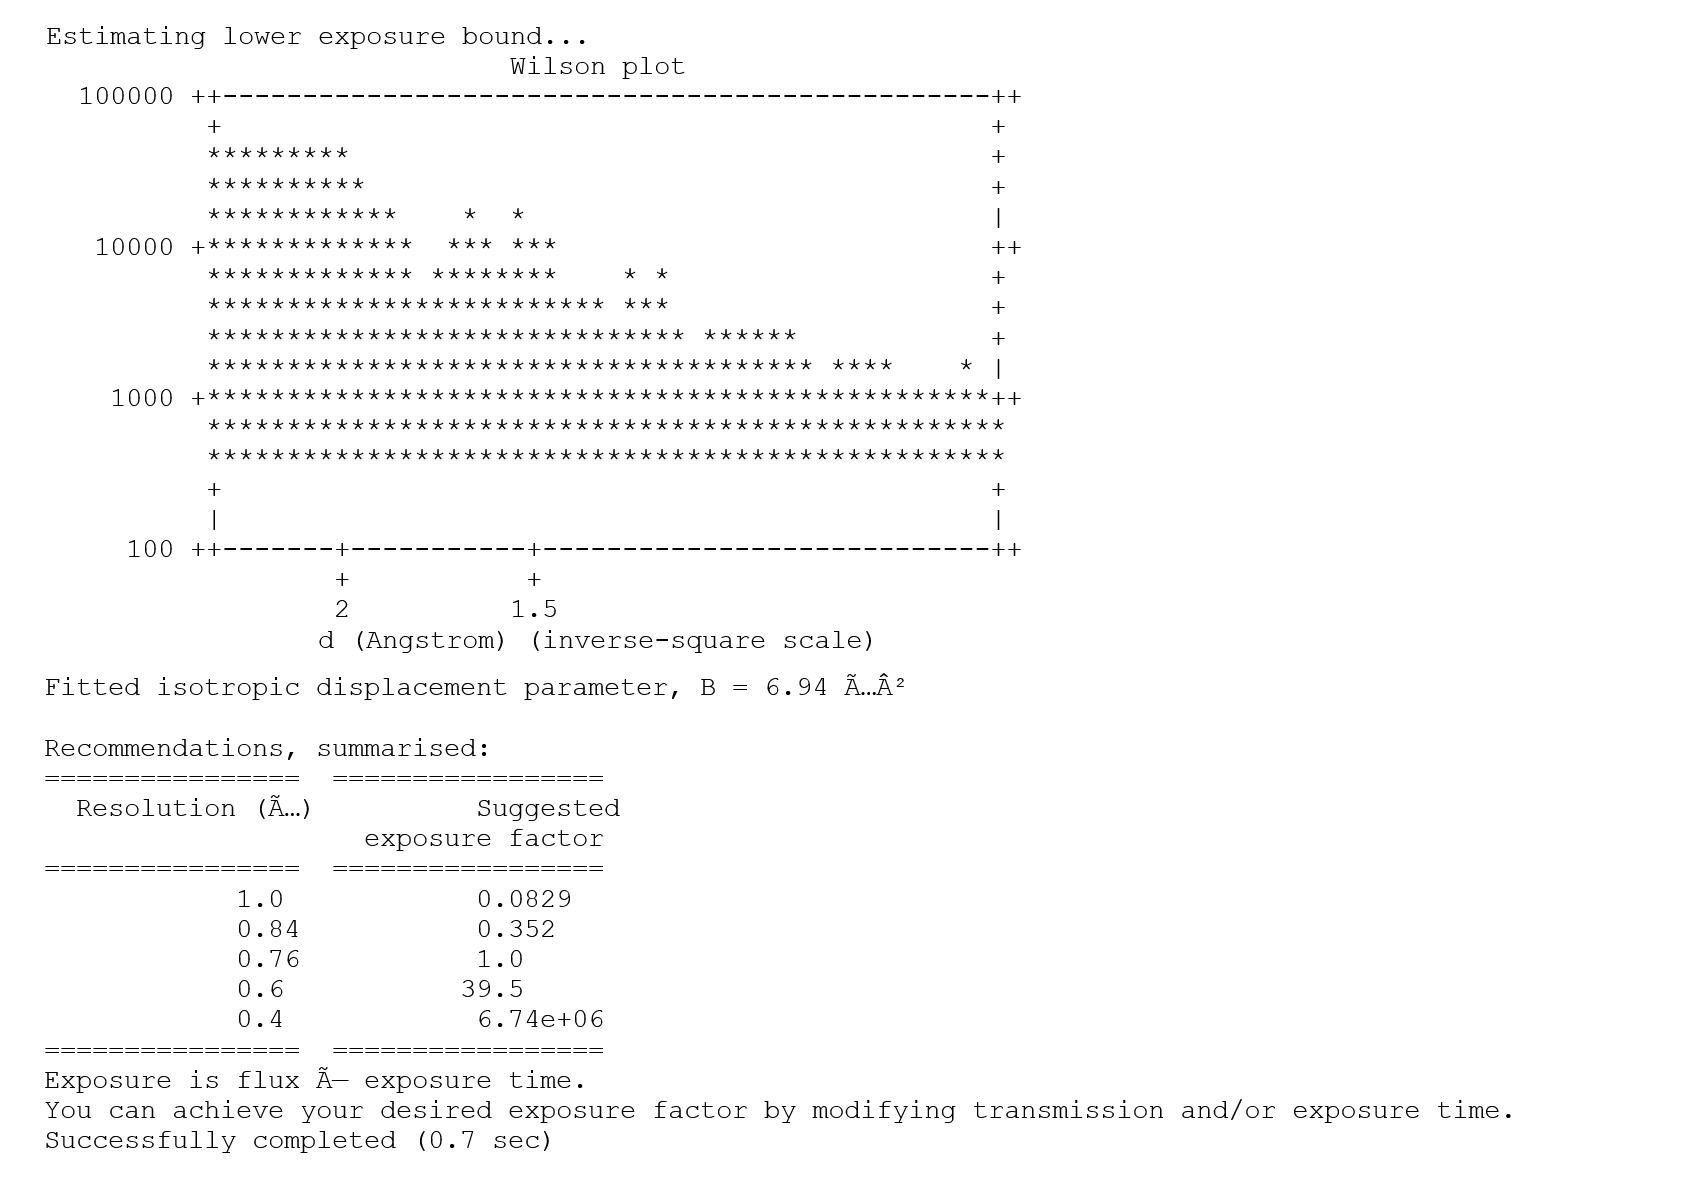
For the example above, if there is strong diffraction beyond 0.84Å, i.e., there are clear diffraction spots to the edge of the detector for the screening run (check the images visually!), then the spot intensity histogram (detector limit) recommends decreasing the transmission by about 1/3 (2/3 of 36 = 24%). The table suggests that 1/3 of the current transmission is sufficient to obtain good data to 0.84Å so collecting with 2/3 of the current transmission would be fine.
1.) If there is little evidence of diffraction to this required limit, then sticking with the attenuation level used for the screen will be fine in this instance because the built-in detector count rate correction should be able to adjust for the few reflections which are too strong.
2.) If the suggested transmission to achieve the required resolution is greater than the transmission recommended by the detector count rate limit, then the data collection time needs to be increased in order to collect stronger data. For example, to collect weaker spots it may be appropriate to halve the speed of data collection by collecting 0.2° images in 0.4 seconds (rather than the default 0.2° in 0.2 seconds). Do not go over the detector threshold.
If for any reason screen19 does not run automatically, it can be run manually in the following way:
Navigate to the “processing” directory – note that this is the only place you have permission to write files.
Create a suitably named directory (mkdir foldername) and enter it (cd foldername)
Type screen19 /dls/i19-1/data/YEAR/cyxxxxx-x/samplename/*.cbf
(the path to where the images are saved)
The transmission for a data collection is set using the transmission column in the GDA data collection table. The attenuation elements are driven by specifying the percentage transmission required - this is shown in the Axis control tab. The level of transmission required will determine which wedge is used - higher levels are achieved using the resin wedge (ATTENX) whilst lower levels are achieved using the aluminium wedge (ATTENY).
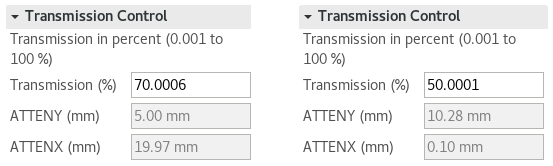
For example, at 0.6889 Å, 50% of the incident beam transmission is achieved by inserting a thickness of 0.5 mm of Al into the beam. This is the thickness of the wedge when ATTENY is set to 10.28 mm.
Note that ATTENX is out of the beam at 0.10 mm, whereas ATTENY is out of the beam at 5.00 mm.
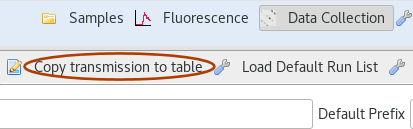
Clicking on the Copy transmission to table button will update the transmission for all scans in the data collection table to match the value currently set in the Transmission Control box.
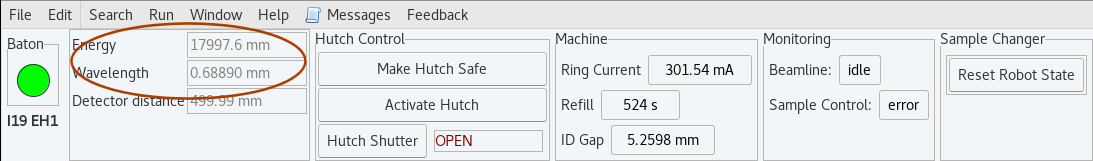
The transmission is calculated using the set wavelength so it is worth checking this is reported correctly in the top menu of the GDA – if the wavelength shown doesn’t match the expected value, please report it.

Diamond Light Source is the UK's national synchrotron science facility, located at the Harwell Science and Innovation Campus in Oxfordshire.
Copyright © 2022 Diamond Light Source
Diamond Light Source Ltd
Diamond House
Harwell Science & Innovation Campus
Didcot
Oxfordshire
OX11 0DE
Diamond Light Source® and the Diamond logo are registered trademarks of Diamond Light Source Ltd
Registered in England and Wales at Diamond House, Harwell Science and Innovation Campus, Didcot, Oxfordshire, OX11 0DE, United Kingdom. Company number: 4375679. VAT number: 287 461 957. Economic Operators Registration and Identification (EORI) number: GB287461957003.

 Crystallography