
Beamline Phone Number:
+44 (0) 1235 778418
Principal Beamline Scientist:
Dave Allan
Tel: +44 (0) 1235 778644
E-mail: [email protected]
Email: [email protected]
Tel: +44 (0)1235 4494052
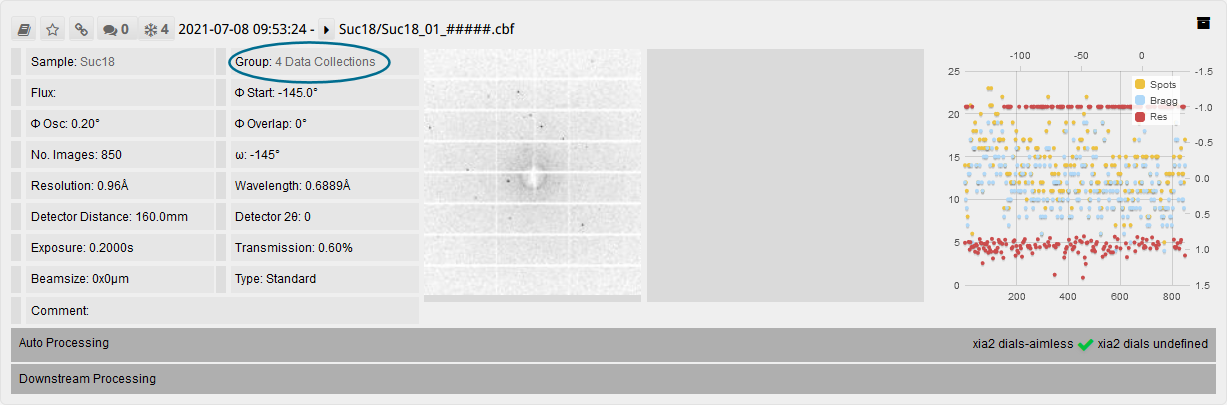
Make sure to click on the link (next to Group) to take you to the results for the full data collection, in order to see the processing summaries at each step.
If, for example you have collected data using the Default Run List, you will have 4 sweeps of data and, therefore, 4 sets of auto processing jobs. These are undertaken sequentially, so the first job just consists of sweep 1, the second has sweeps 2 and 1, the third has sweeps 3, 2 and 1 etc. The final job, at the top of the list should contain the processing for all sweeps collected, as indicated by the highest completeness to the maximum resolution.
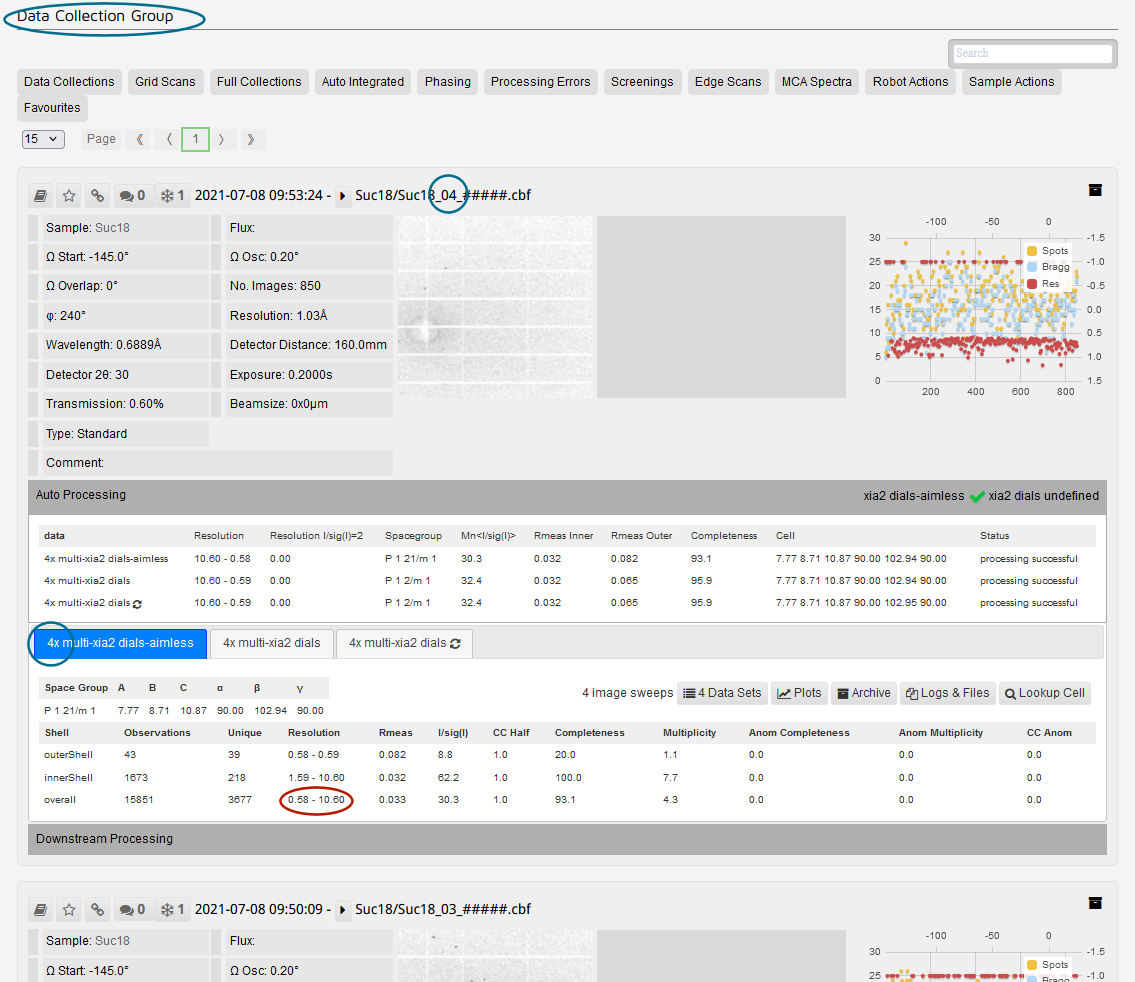
The tab title clearly indicates how many sweeps of data have been used. Sometimes, this number will be less than expected due to one or more sweeps failing to integrate successfully.
A summary of the auto processing results is given within the Auto Processing tab – click on Auto Processing for the data collection you are interested in, to open it up, and then select the processing job from the list of tabs - auto processing is run twice, once using aimless for the absorption correction and once using dials.scale.
If a space group and unit cell have been provided for that sample (as part of the puck filling process) then auto processing will be also be run for each scaling process but with the cell information included.
Generally, xia2 dials gives better results than xia2 dials-aimless but sometimes one will work when the other fails, as indicated by green ticks or red crosses.
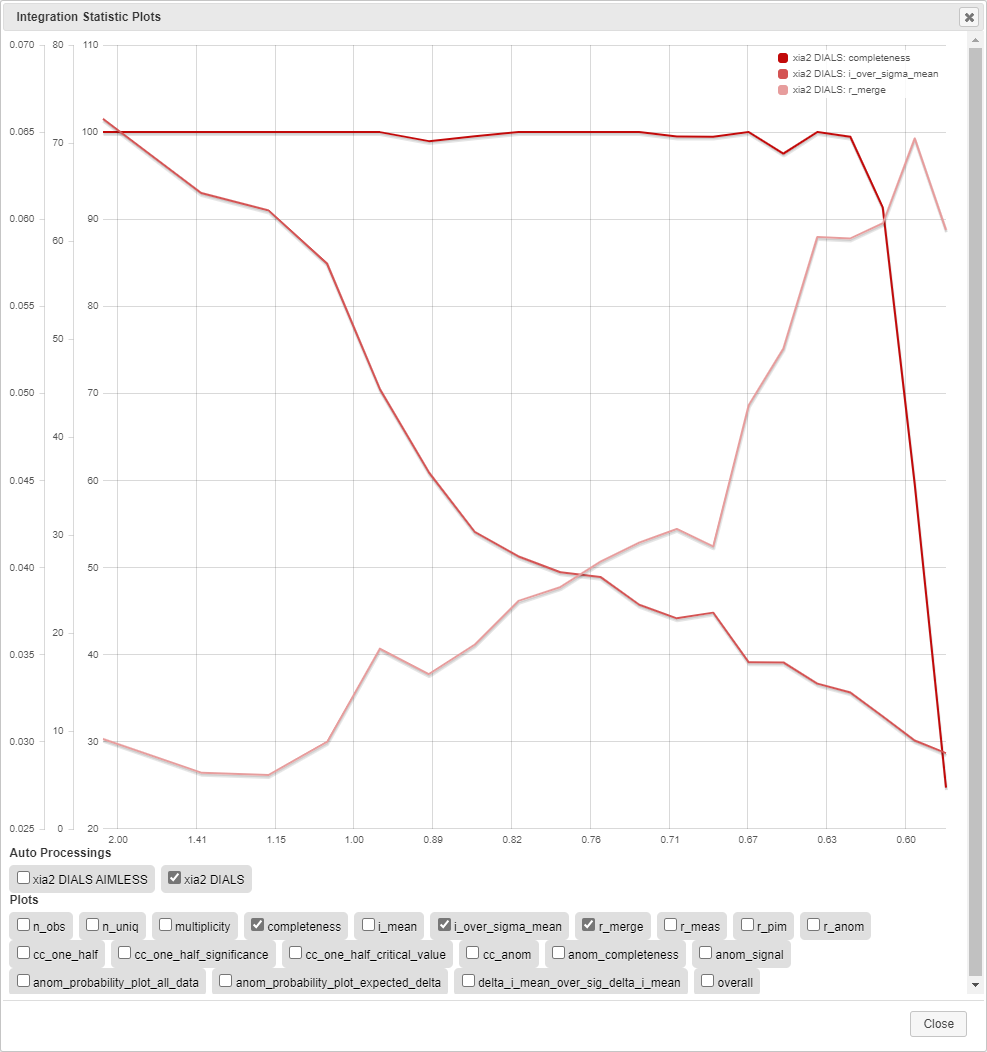
Completeness, mean I/σ and Rmerge are plotted by default but it is easy to show other things by swapping which check boxes are ticked. It is also possible to compare the results for multiple processing jobs by selecting the relevant processing jobs.
Clicking on this will produce a list of all auto processing results, across all visits you are associated with, which match the unit cell of the dataset you are looking at.
Clicking on Logs and Files will bring up a menu listing many of the files output from the processing job. These files are always available via ISPyB, even after the data has been archived.
Seleect files to either view or download by clicking on Download (rather than View).
shelxt.ins
shelxt.hkl
Although shelxt is run automatically on these files, the resulting res files are not available in this list.
It may be easiest to download these input files and rerun shelxt manually on a local system as this is likely to have write access.
Make sure to download the files from the complete dataset (within the data collection group) NOT the ones available from the Data Collections page as these are just for the first sweep of data, generally the 2 theta=0 phi scan.
It also gives you the opportunity to include the relevant atom types which obviously leads to a greater chance of a successful solution. At the moment, it is not possible to push this knowledge through to the auto processing.
xia2.cif contains information regarding the software, versions and references used for the auto processing. It also contains the appropriate cif entries and references for the use of EH1, including _diffrn_radiation_wavelength, _diffrn_measurement_device etc.
Note: The hkl ranges and _diffrn_reflns_number are not calculated correctly so these should be obtained from the raw data in the hkl file.
xxxxx_merging-statistics.txt
This file gives an xprep style output table showing multiplicity, Rmerge, completeness etc. per resolution shell. The same information can be obtained from the plots, so it is just an alternative view depending on whether you find the table or graphs easier to interpret. At the top, there is a useful summary of the overall statistics.
Information from the merging-statistics and xia2.txt are combined and summarised here.
The Summary tab gives the same information as found at the top of the merging statistics file with values for all data and (outer resolution shell). The xia2 output button opens the xia2.txt file.
The Dataset SAD tab shows the table produced at the bottom of the xia2.txt file. Opening Resolution shells reveals the whole table from the merging-statistics file.
There are a number of plots available:
The xia2.txt file summarises the processing information, starting with spot finding, then indexing, then integration and finally cell refinement.

Diamond Light Source is the UK's national synchrotron science facility, located at the Harwell Science and Innovation Campus in Oxfordshire.
Copyright © 2022 Diamond Light Source
Diamond Light Source Ltd
Diamond House
Harwell Science & Innovation Campus
Didcot
Oxfordshire
OX11 0DE
Diamond Light Source® and the Diamond logo are registered trademarks of Diamond Light Source Ltd
Registered in England and Wales at Diamond House, Harwell Science and Innovation Campus, Didcot, Oxfordshire, OX11 0DE, United Kingdom. Company number: 4375679. VAT number: 287 461 957. Economic Operators Registration and Identification (EORI) number: GB287461957003.

 Crystallography